What is the R package actel?
If you are using acoustic telemetry to track animals as they move inside a study area or as they migrate somewhere, actel is the R package for you. By bringing together the study area configuration and the recorded detections, actel provides a systematic way of analysing animal migration and residency data.

Choose the analysis that fits your study
Explore
explore() allows you to quickly get a summary of your data. You can use explore() to get a general feel for the study results, and check if the input files are behaving as expected. It is also a good candidate if you just want to validate your detections for later use in other analyses.
Migration
The migration() analysis runs the same initial checks as explore(), but on top of it, it analyses the animal behaviour. By selecting the arrays that lead to success, you can define whether or not your animals survived the migration. Additional plots help you find out if some animal/tag has been acting odd. Multiple options allow you to tweak the analysis to fit your study perfectly.
Residency
The residency() analysis runs the same initial checks as explore(), but, similarly to migration, explores particular points of the animal behaviour. If you want to know where your animals were in each day of the study, how many animals were in each section each day, and other residency-focused variables, this is the analysis you are looking for!
A variety of outputs
To truly learn how to operate actel, you must read the manual carefully. The manual has been arranged so that you can prepare your analysis as you learn; quite soon you will get your first results! Here are some examples:
Movement tables:
| Array | Detections | First station | Last station | First time | Last time | Time travelling | Time on array |
|---|---|---|---|---|---|---|---|
| River1 | 14 | St.1 | St.2 | 2019-05-15 10:30:00 | 2019-05-15 13:00:00 | 25:20:14 | 2:30:00 |
| River2 | 3 | St.4 | St.4 | 2019-05-15 13:50:00 | 2019-05-15 14:40:00 | 0:50:00 | 0:50:00 |
| River3 | 8 | St.5 | St.6 | 2019-05-15 16:00:00 | 2019-05-15 16:20:00 | 1:20:00 | 0:20:00 |
| Fjord2 | 21 | St.10 | St.11 | 2019-05-16 15:10:00 | 2019-05-16 18:00:00 | 22:50:00 | 2:50:00 |
| Sea1 | 1 | St.18 | St.18 | 2019-05-18 09:45:00 | 2019-05-18 09:45:00 | 15:45:00 | 0:00:00 |
Detection graphics
Times of arrival and summary information


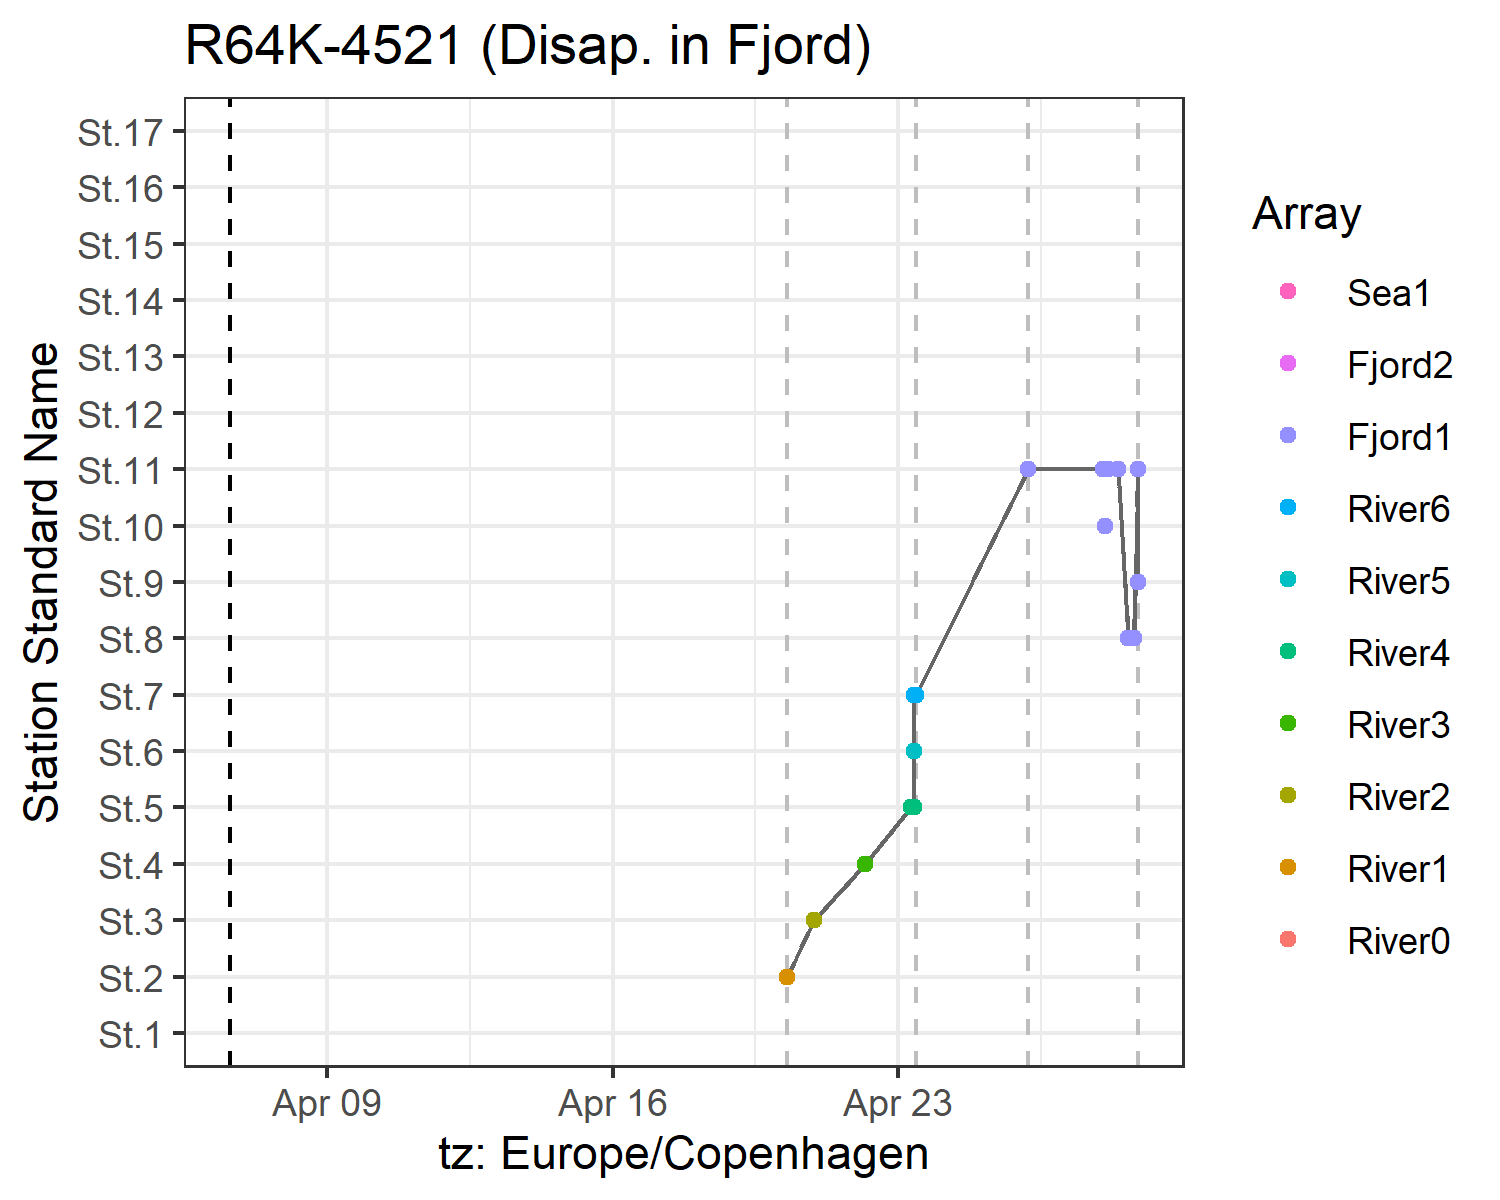
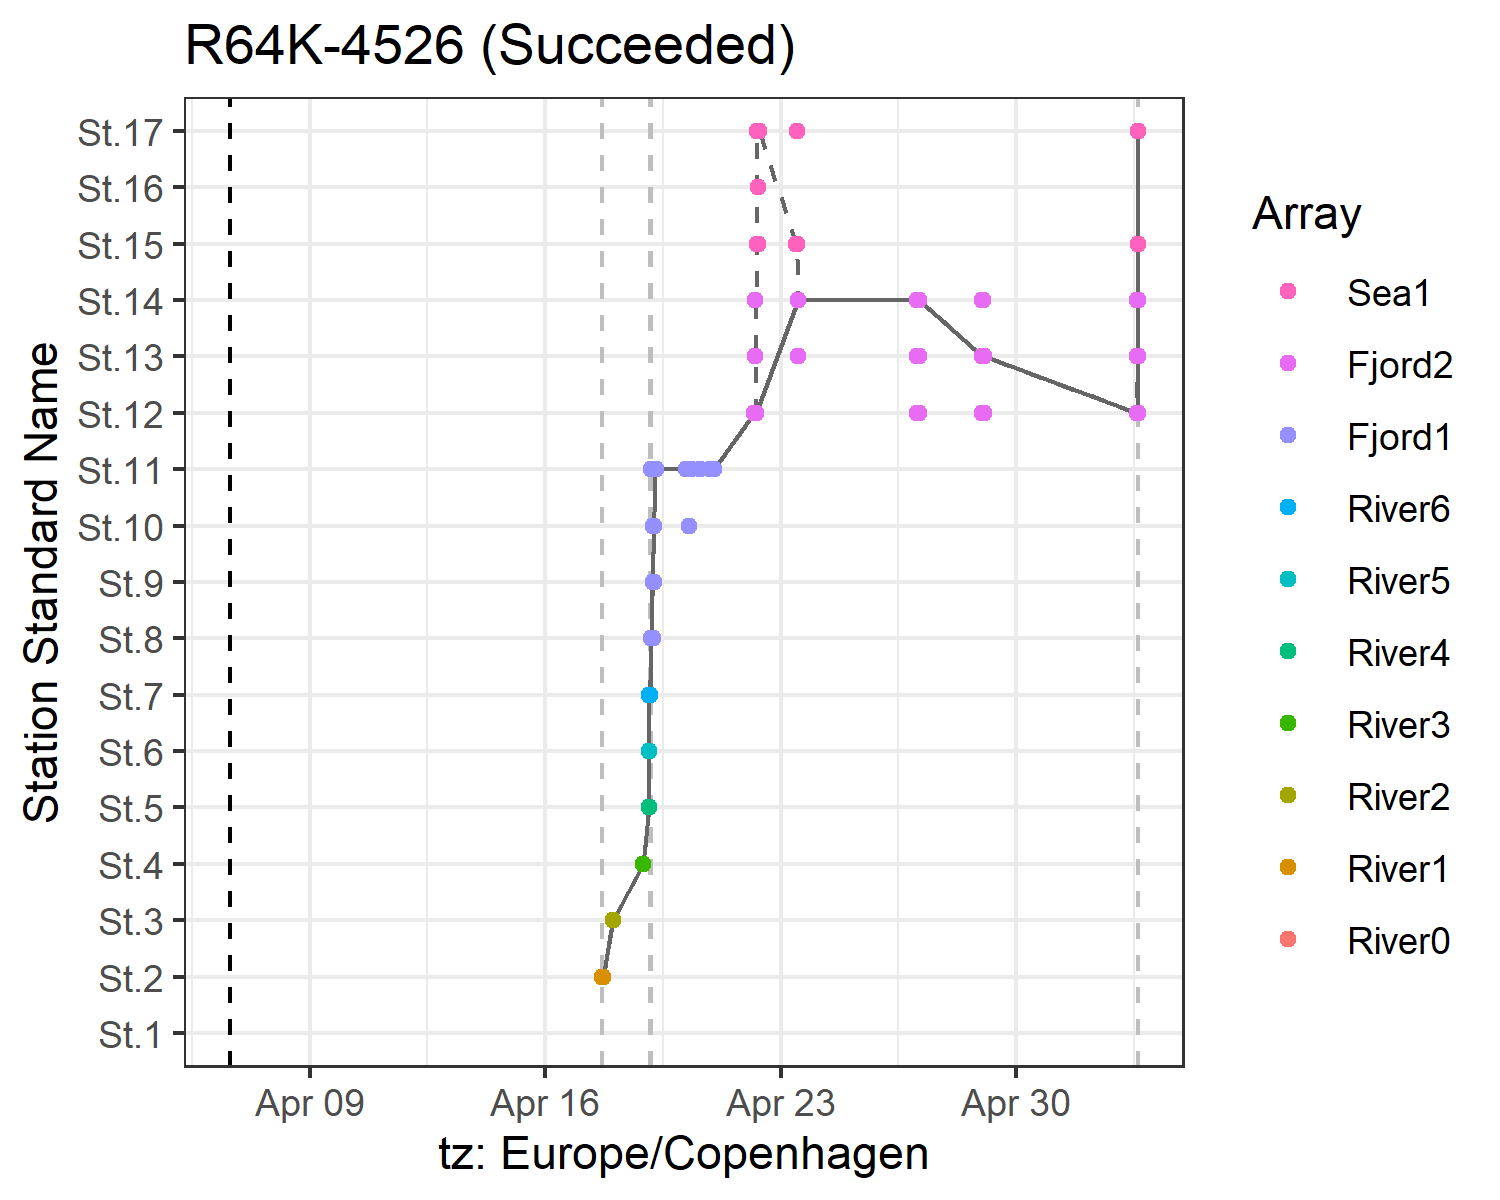
Array efficiency and tag progression

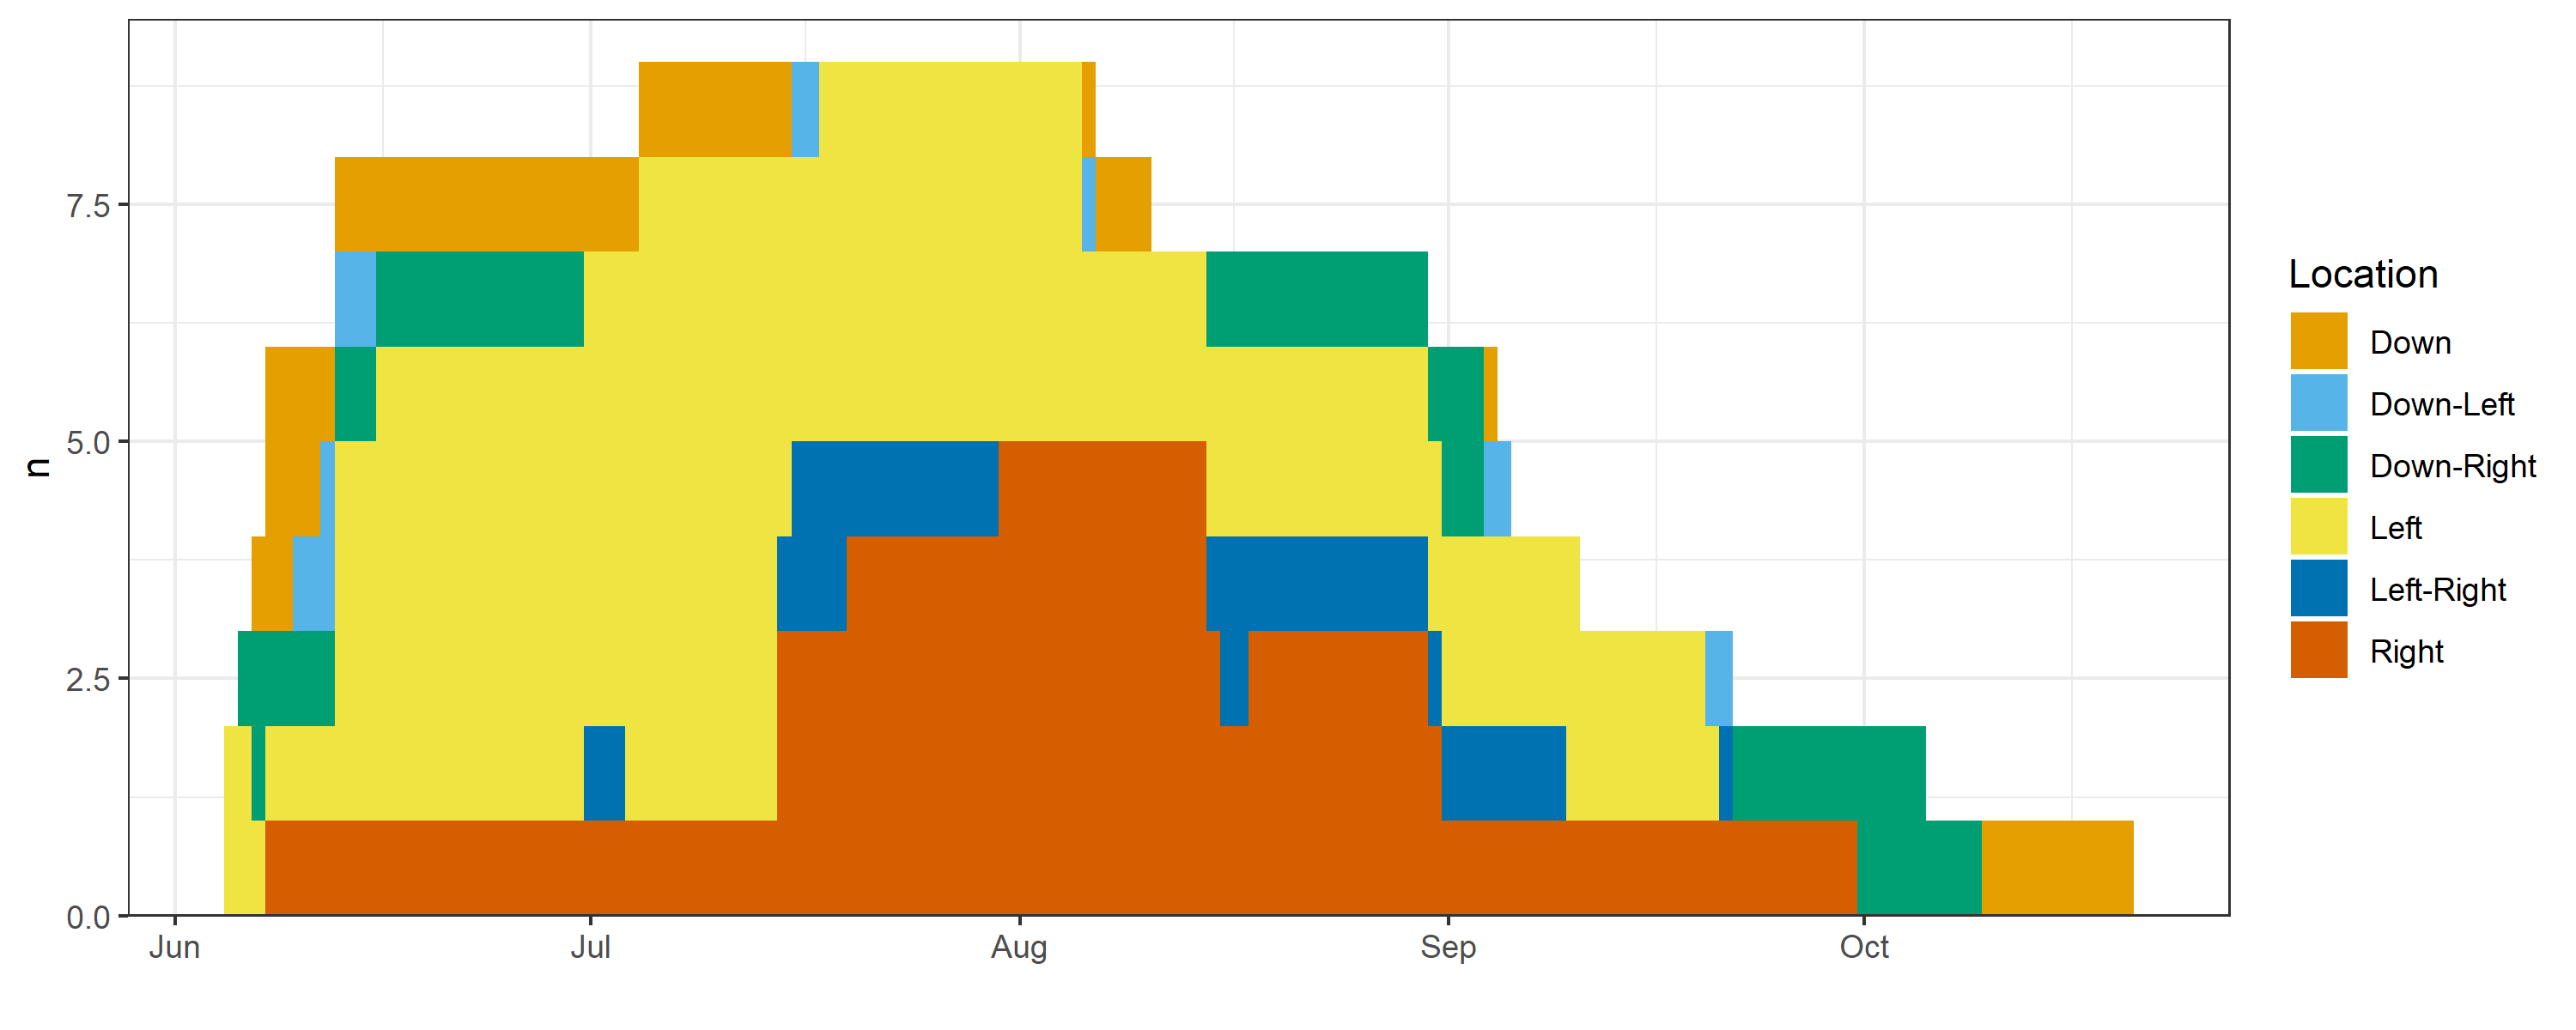
Individual residency
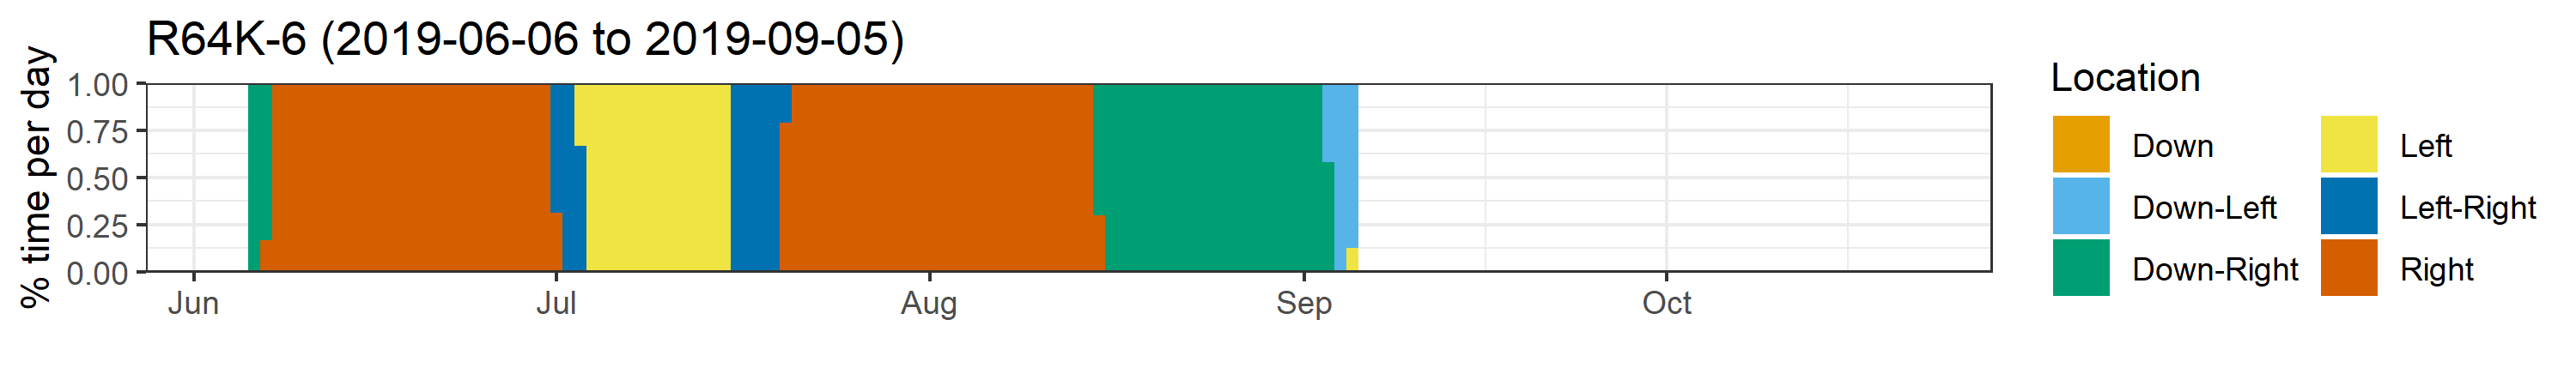
Global residency