The explore() function
The arguments in the explore() function are transversal to the migration() and residency() functions.
Although there are many arguments available, you do not need to start working with all of them right away. This is because many of these arguments have default values. If you want to make a quick check of your study, just run explore() with a tz argument in the same directory as your data and you will be ready to get some results!
E.g.:
explore(tz = "Europe/London")Curious about how explore() processes your data? Have a look under the hood!
Need help going through the output of explore()? Find more details here.
General arguments
All the arguments of explore(), which also exist in migration() and residency(), are explained below.
explore(tz, max.interval = 60, minimum.detections = 2, start.time = NULL, stop.time = NULL,
  speed.method = c("last to first", "first to first"), speed.warning = NULL,
  speed.error = NULL, jump.warning = 2, jump.error = 3, inactive.warning = NULL,
  inactive.error = NULL, exclude.tags = NULL, override = NULL, report = FALSE,
  auto.open = TRUE, discard.orphans = FALSE, discard.first = NULL, discard.orphans = FALSE,
  save.detections = FALSE, GUI = c("needed", "always", "never"), save.tables.locally = FALSE,
  detections.y.axis = c("stations", "arrays"))
tz
Receivers usually work in Coordinated Universal Time (UTC). Although this is nice to integrate data from multiple receivers, depending on where you are working, it may mean that the receivers' time is actually displaced from the daytime in your study area. To correct for this, you must include your time zone in this field. For example, to analyse a study performed in Denmark, we must use tz = "Europe/Copenhagen".
Time zones can be complicated business, so to help you out, you can search this wiki page or the output of OlsonNames() for the time zone code which you should use.
This time zone must match the time zone of the release times listed in the biometrics file and in the deployments file.
max.interval
If an animal is detected multiple times in one array without being detected in other arrays, these detections are grouped into a single event, assuming that the time difference between two consecutive detections does not exceed max.interval (which is set in minutes). Should the time between detections exceed max.interval, a new movement event will be created, in the same receiver array.
In the example below, you can see how the same detections can be interpreted as a different number of movement events depending on whether we set max.interval to a) 120 minutes, b) 60 minutes or c) 30 minutes.

Movements table for example a:
| Array | Detections | First station | Last station | First time | Last time | Time travelling | Time on array |
|---|---|---|---|---|---|---|---|
| Array1 | 14 | St.1 | St.1 | 2019-05-15 12:00:00 | 2019-05-15 19:45:00 | NA | 7:45:00 |
Movements table for example b:
| Array | Detections | First station | Last station | First time | Last time | Time travelling | Time on array |
|---|---|---|---|---|---|---|---|
| Array1 | 7 | St.1 | St.1 | 2019-05-15 12:00:00 | 2019-05-15 14:40:00 | NA | 2:40:00 |
| Array1 | 6 | St.1 | St.1 | 2019-05-15 16:00:00 | 2019-05-15 18:00:00 | 1:20:00 | 2:00:00 |
| Array1 | 1 | St.1 | St.1 | 2019-05-15 19:45:00 | 2019-05-15 19:45:00 | 1:45:00 | 0:00:00 |
Movements table for example c:
| Array | Detections | First station | Last station | First time | Last time | Time travelling | Time on array |
|---|---|---|---|---|---|---|---|
| Array1 | 4 | St.1 | St.1 | 2019-05-15 12:00:00 | 2019-05-15 13:00:00 | NA | 1:00:00 |
| Array1 | 3 | St.1 | St.1 | 2019-05-15 13:50:00 | 2019-05-15 14:40:00 | 0:50:00 | 0:50:00 |
| Array1 | 2 | St.1 | St.1 | 2019-05-15 16:00:00 | 2019-05-15 16:20:00 | 1:20:00 | 0:20:00 |
| Array1 | 4 | St.1 | St.1 | 2019-05-15 17:10:00 | 2019-05-15 18:00:00 | 0:50:00 | 0:50:00 |
| Array1 | 1 | St.1 | St.1 | 2019-05-15 19:45:00 | 2019-05-15 19:45:00 | 1:45:00 | 0:00:00 |
minimum.detections
This argument controls how many times a tag must be registered to be considered valid, if there is only one movement event. Lets have a look at an example: Tag 1234 only has one movement event at River1, with one detection. If minimum.detections = 1, this movement is considered valid , and the tag is considered to have passed through River1 and then disappeared. If minimum.detections = 2, this movement is considered invalid (i.e. could be the result of error detections), and the tag is considered to have been lost after release. If a tag has more than one movement event, then the minimum.detections argument no longer plays a role.
For example, if tag 5678 has two movement events at River1, both with one detection (i.e. two detections in total), these movements are considered valid even if minimum.detections = 3. This is because it is unlikely that an erroneous signal which matches a target tag would be recorded on two or more occasions separated in time and/or space.
start.time and stop.time
Sometimes your receivers contain much more detection data than what you are interested in, which can increase the time it takes to process all the detections. By including a start.time and/or an stop.time, you can trim the detection data to those target times.
This is particularly relevant if, for example, you used some of your tags as testers before the study started, or if you used one of the receivers to activate and test the tags. A tag being detected before the respective animal being released is a major issue, and actel will complain about that:
Error: Tag R64K-1111 was detected before being released!
       Release time: 2018-04-10 12:00:00
       First detection time: 2018-04-10 09:33:02
       Number of detections before release: 1

You may either:
  a) Stop the analysis and check the data;
  b) Discard the before-release detections and continue.

Decision:(a/b/comment)
When you get an error like this, it is highly recommended that you check potential errors in the input files before discarding data.
The timestamps must be written in yyyy-mm-dd hh:mm:ss format, in the same time zone as your study area. Curious about that "comment" option in the decision? Read more about it here
speed.method
When calculating movement speeds from one array to the next, it is important to know if actel should count the time from the last detection in the previous array to the first detection in the target array, or if you want actel to count the time from the last detection in the previous array to the last detection in the target array. This is what speed.method is doing. You can choose one of "last to first" or "last to last". The example below illustrates the difference between both methods:

If you do not supply a distance matrix, speeds cannot be calculated. Instead, the time difference will be displayed.
There are two main consequences of choosing different options for speed.method. The first is that the "average.speed.m.s" column in the movement events will reflect the respective "Speed to X" in the graphic above. The second is only relevant during the migration analysis: if speed.method = "first to last", speed will be displayed in two columns in the status.df object: "Average.speed.to.[Section]" and "Average.speed.in.[Section]"; while if speed.method = "last to last", only the "Average.speed.to.[Section]" will be generated.
speed.warning and speed.error
These two variables control the speed checks. By default, they are NULL, and no speed checks are performed. actel will let you know this happened with the following message:
M: 'speed.warning'/'speed.error' were not set, skipping speed checks.
However, if you include a distances matrix in the analysis, you can specify the maximum expected speed for your animals, in metres per second. If a tag goes over these values, warnings and user interaction will be activated, as necessary.
Speed checks cannot be performed without a distance matrix. If you attempt to do this, actel will complain:
Warning: 'speed.warning'/'speed.error' were set, but a valid distance matrix is not present. Aborting speed checks.
jump.warning and jump.error
During the course of a study, tags can (hopefully not too often) pass through a receiver array undetected. However, if this happens consecutively for more than one array, then perhaps something fishy is going on. Was your animal eaten by a bird? Was there something wrong with the arrays? Whatever the cause, there is a point after which you get suspicious. The jump.warning and jump.error arguments control how suspicious you want to be.
You can have a look at these arguments in action here.
inactive.warning and inactive.error
These two variables control the inactiveness checks. inactive.warning and inactive.error must be set in days. That is, if inactive.warning = 2, any tag that is deemed inactive for two days or more will trigger a warning. By default, they are NULL, and no inactiveness checks are performed. Actel will let you know this happened with the following message:
M: 'inactive.warning'/'inactive.error' were not set, skipping inactivity checks.
Although it is not a requirement, inactiveness checks work best if a distances matrix is present. If you choose to run inactiveness checks without a distances matrix, actel will remind you of this with the following message:
M: Running inactiveness checks without a distance matrix. Performance may be limited.
You can learn more about how the inactiveness checks operate here.
exclude.tags
It is possible for a stray tag with the same signal as one of your tags to enter the study area. Although this is unexpected, it would mean you could end up with two tags that differ only in code spaces. As actel works based on the tag signals alone, it does not know which tag is yours, and which is a stray, so you must intervene. If this happens, the following error is issued:
Error: One or more signals match more than one tag in the detections! Showing relevant signals/tags.
       Signal 1081 was found on tags A69-1601-1081, R64K-1081.
Error in checkDupSignals(input = my.list, bio = bio, tag.list = tags$list) :
  Fatal exception found. Stopping analysis.
As you can see above, signal 1081 appears both in tags A69-1601-1081 and R64K-1081. As you should be able to identify your tag between the two, you can exclude the other tag and re-start the analysis. Once you do that, actel will let you know the problem is solved:
M: Excluding tag(s) A69-1601-1081 from the analysis per used command (detections removed: 1, respectively).
If more than one tag causes trouble, you can list multiple tags to be excluded, like this: exclude.tags = c("A69-1601-1081", "A69-1601-1220").
override
Once you finish your analysis, you should go through the generated outputs and check for any strange behaviour. We will discuss this in more detail [later on](b-2_explore_results.html), but for now the important message is that, if you would like to manually change the results for any set of tags , you can list their respective signals in override to trigger full manual mode (e.g. override = c(1234, 1405)).
When you list tags in override, actel will recognise them and enter full manual mode when it is their turn to be analysed. You will know this is happening when you see the following message:
M: Override has been triggered for tag R64K-1234. Entering full manual mode.
You can find more information on how to operate full manual mode here.
report
The report option activates a series of print functions that draw tables and figures for later integration in an html report. When you activate this option, actel assembles the html report and stores it in your working directory. If you already have a report in your working directory, actel will create a new file with a different name.
Here are some graphic examples:

auto.open
When the report option is activated, auto.open comes into play. If auto.open is TRUE (the default), then actel will automatically open your web browser and open the report as soon as it is completed!
discard.orphans
This is a flow optimization argument. When actel finds detections outside of the receiver deployment periods, or that were recorded before their respective animals were released, by default, actel will ask the user what to do (discard those detections or stop the analysis so the user can check the data). However, you can tell actel to automatically discard any orphan detections by setting discard.orphans to TRUE.
discard.first
This argument allows you to discard any detections that happen too soon after the animal was released. You may want to do this to ensure your results are not biased by post-handling disturbance effects. discard.first is set in hours, but if for example you want to set a time in days, you can always state that discard.first = 24 * 7 (for seven days in this case).
save.detections
Detections can take a long time to compile. To save some time when importing the detections, you can set save.detections to TRUE and actel will save an 'actel.detections.RData' file in your current working directory (or in the detections sub-directory) for later use. This option is particularly useful when handling very large detection datasets.
GUI
actel comes with a graphical interface intended to allow users to deal with very long movement tables that would otherwise overflow R's output limits. However, this graphical interface requires additional packages installed, so it may not always be an option to rely on it. This is where GUI comes in. Defaulting to 'needed', the graphical user interface will only kick in for very long tables. The other two options are 'always' and 'never', both of which are self explanatory.
If you cannot run the GUI on your computer and are faced with a very long table, do not worry! actel has a fall-back system, where the table is saved to a temporary file, which you can open in an external program such as Microsoft Excel of LibreOffice Calc. Have a look at the movements table there, let R know what you want to do, close the file and the analysis will continue automatically. This option requires a bit more work, but at least you can still complete your analysis :)
save.tables.locally
If actel is unable to access the GUI, long tables will be saved to temporary files (as mentioned above). By default, these tables are saved into R's temporary directory. However, in some cases (particularly in MacOS), this temporary folder can be hard to find. You can set save.tables.locally = TRUE to have temporary tables saved in your current work directory, rather than the temporary folder. These temporary tables will be deleted once they are no longer required.
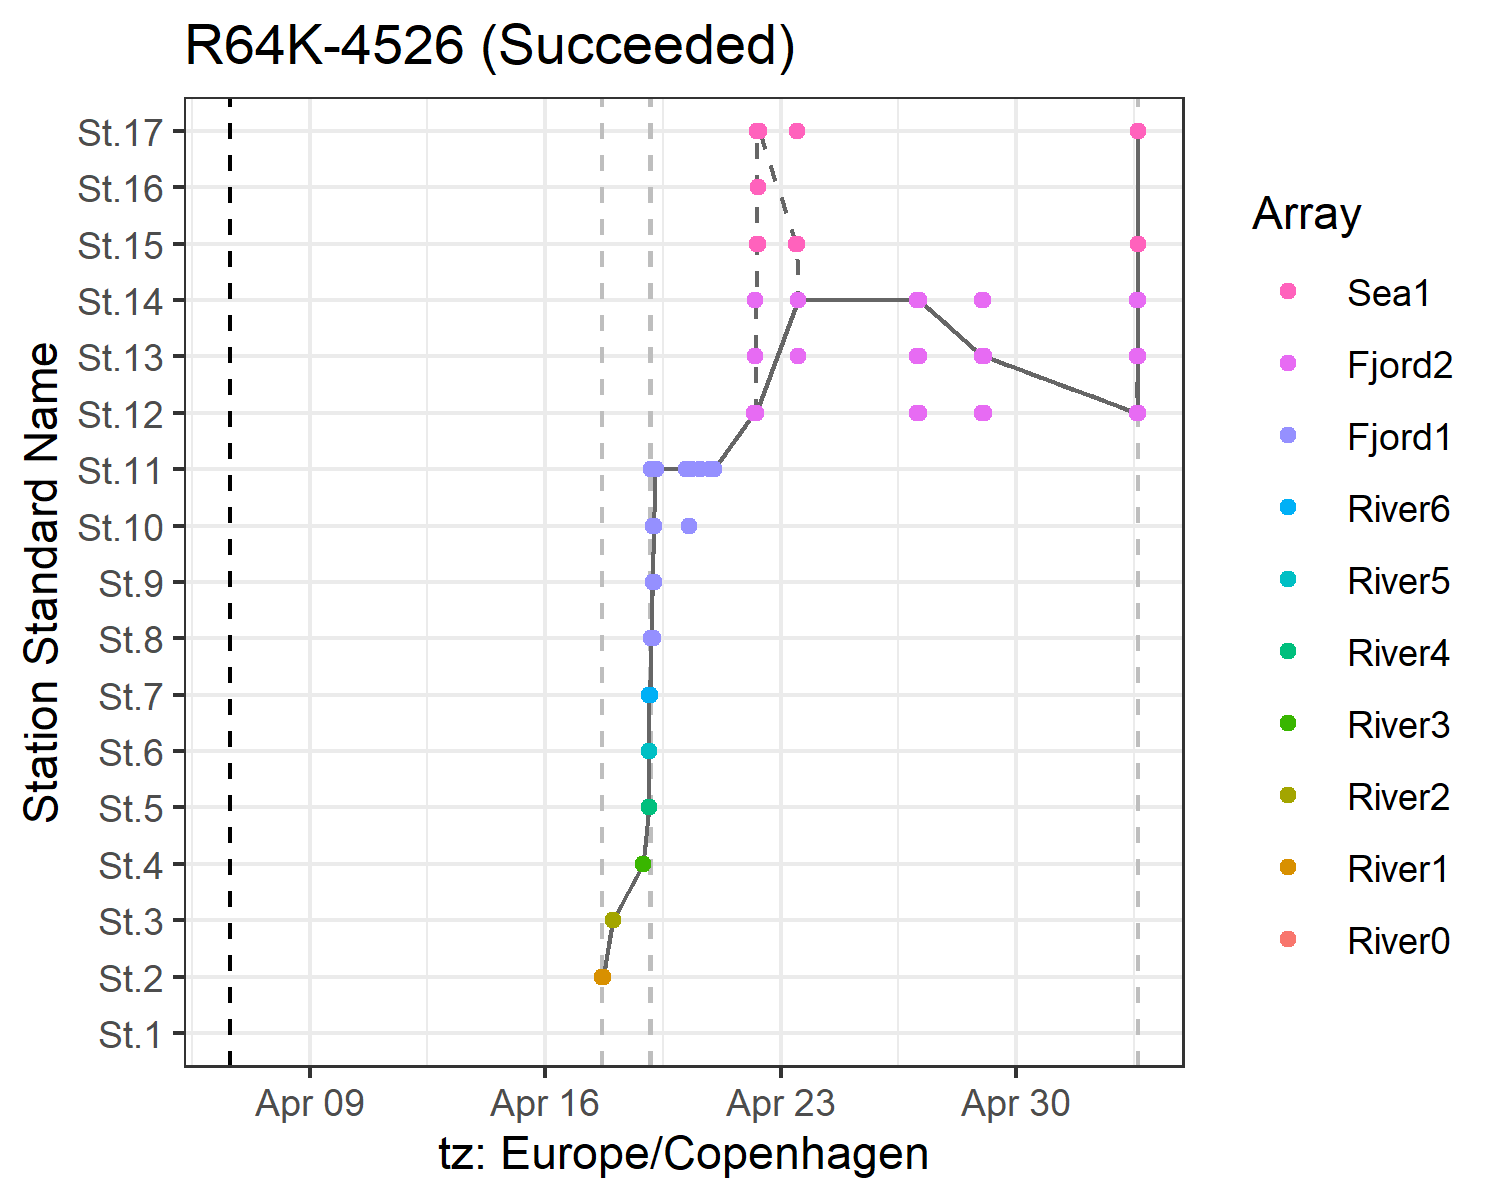
detections.y.axis
By default, actel decides whether to plot the detections by station or by array, depending on the number of stations and arrays present in the study area. However, you can force a specific Y axis by setting detections.y.axis to either 'stations' or 'arrays'. Note that this will also affect the sensor data plots, as they are coloured consistently with the detection plots.
All done!
Now that you know how to run the explore analysis, you may want to: